

In a uniformly charged sphere of total charge Q and radius R, the electric field E is plotted as a function of distance from the centre. The graph which would correspond to the above will be :

To determine the correct graph of electric field E versus distance r from the center for a uniformly charged sphere, we need to analyze the behavior of E both inside and outside the sphere.
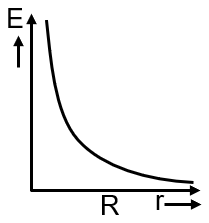
For points outside the sphere (r ≥ R), the sphere behaves as if all its charge Q is concentrated at its center. Thus, the electric field is given by Coulomb's law:
This shows that E ∝ 1/r² for r ≥ R. So, as r increases, E decreases rapidly.
For points inside the sphere (r < R), only the charge enclosed within a Gaussian surface of radius r contributes to the electric field. The charge enclosed is:
Using Gauss's law, the electric field inside is:
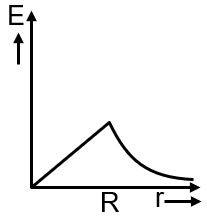
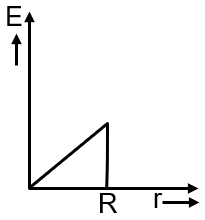
This shows that E ∝ r for r < R. So, inside the sphere, E increases linearly with r.
At the surface (r = R), both expressions give the same value:
So, the graph is continuous at r = R.
The correct graph should show:
Among the options, the graph that matches this is the one where E increases linearly from 0 at r=0 to a maximum at r=R, and then decreases hyperbolically for r>R.
Gauss's Law: The flux through a closed surface is proportional to the charge enclosed.
Charge Density: For a uniform sphere, volume charge density ρ = Q/(4/3 πR³).
Key Formulae: