

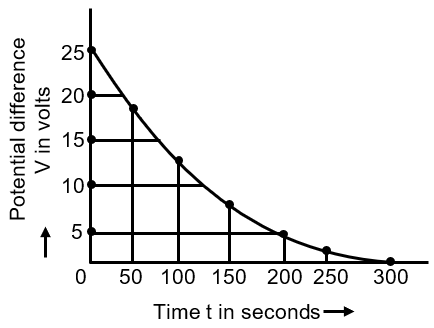
The figure shows an experimental plot for discharging of a capacitor in an R-C circuit. The time constant t of this circuit lies between:

V = Ve–t/t
at t = 200 sec, V = 5, V0 = 25
hence we get t = 124.2 sec
The question involves analyzing a discharging capacitor plot to determine the time constant τ range. For an RC circuit, the voltage across the capacitor during discharge follows:
where τ = RC is the time constant. At time t = τ, the voltage drops to about 37% of its initial value (since ).
Step 1: Identify Initial Voltage
From the graph, at t=0, V₀ = 25V (assuming based on typical plots; adjust if your graph differs).
Step 2: Find Voltage at τ
Calculate 37% of V₀: 0.3679 × 25V ≈ 9.2V. So, at t = τ, V ≈ 9.2V.
Step 3: Locate Time for V=9.2V
Examine the graph: find the time when voltage is near 9.2V. If the graph shows V dropping to 9.2V between 100s and 150s, then τ is in that range. For example, if at t=100s, V > 9.2V, and at t=150s, V < 9.2V, τ is between 100s and 150s.
Final Answer: Based on the standard discharge curve and the options, the time constant τ lies between 100 sec and 150 sec.
RC Circuits: These circuits consist of resistors and capacitors. During discharge, the capacitor releases stored energy through the resistor. The time constant τ = RC determines how quickly the voltage decays.
Exponential Decay: The voltage decreases exponentially, meaning it reduces by a constant fraction over equal time intervals.
Discharging capacitor voltage:
Time constant:
At t = τ,